


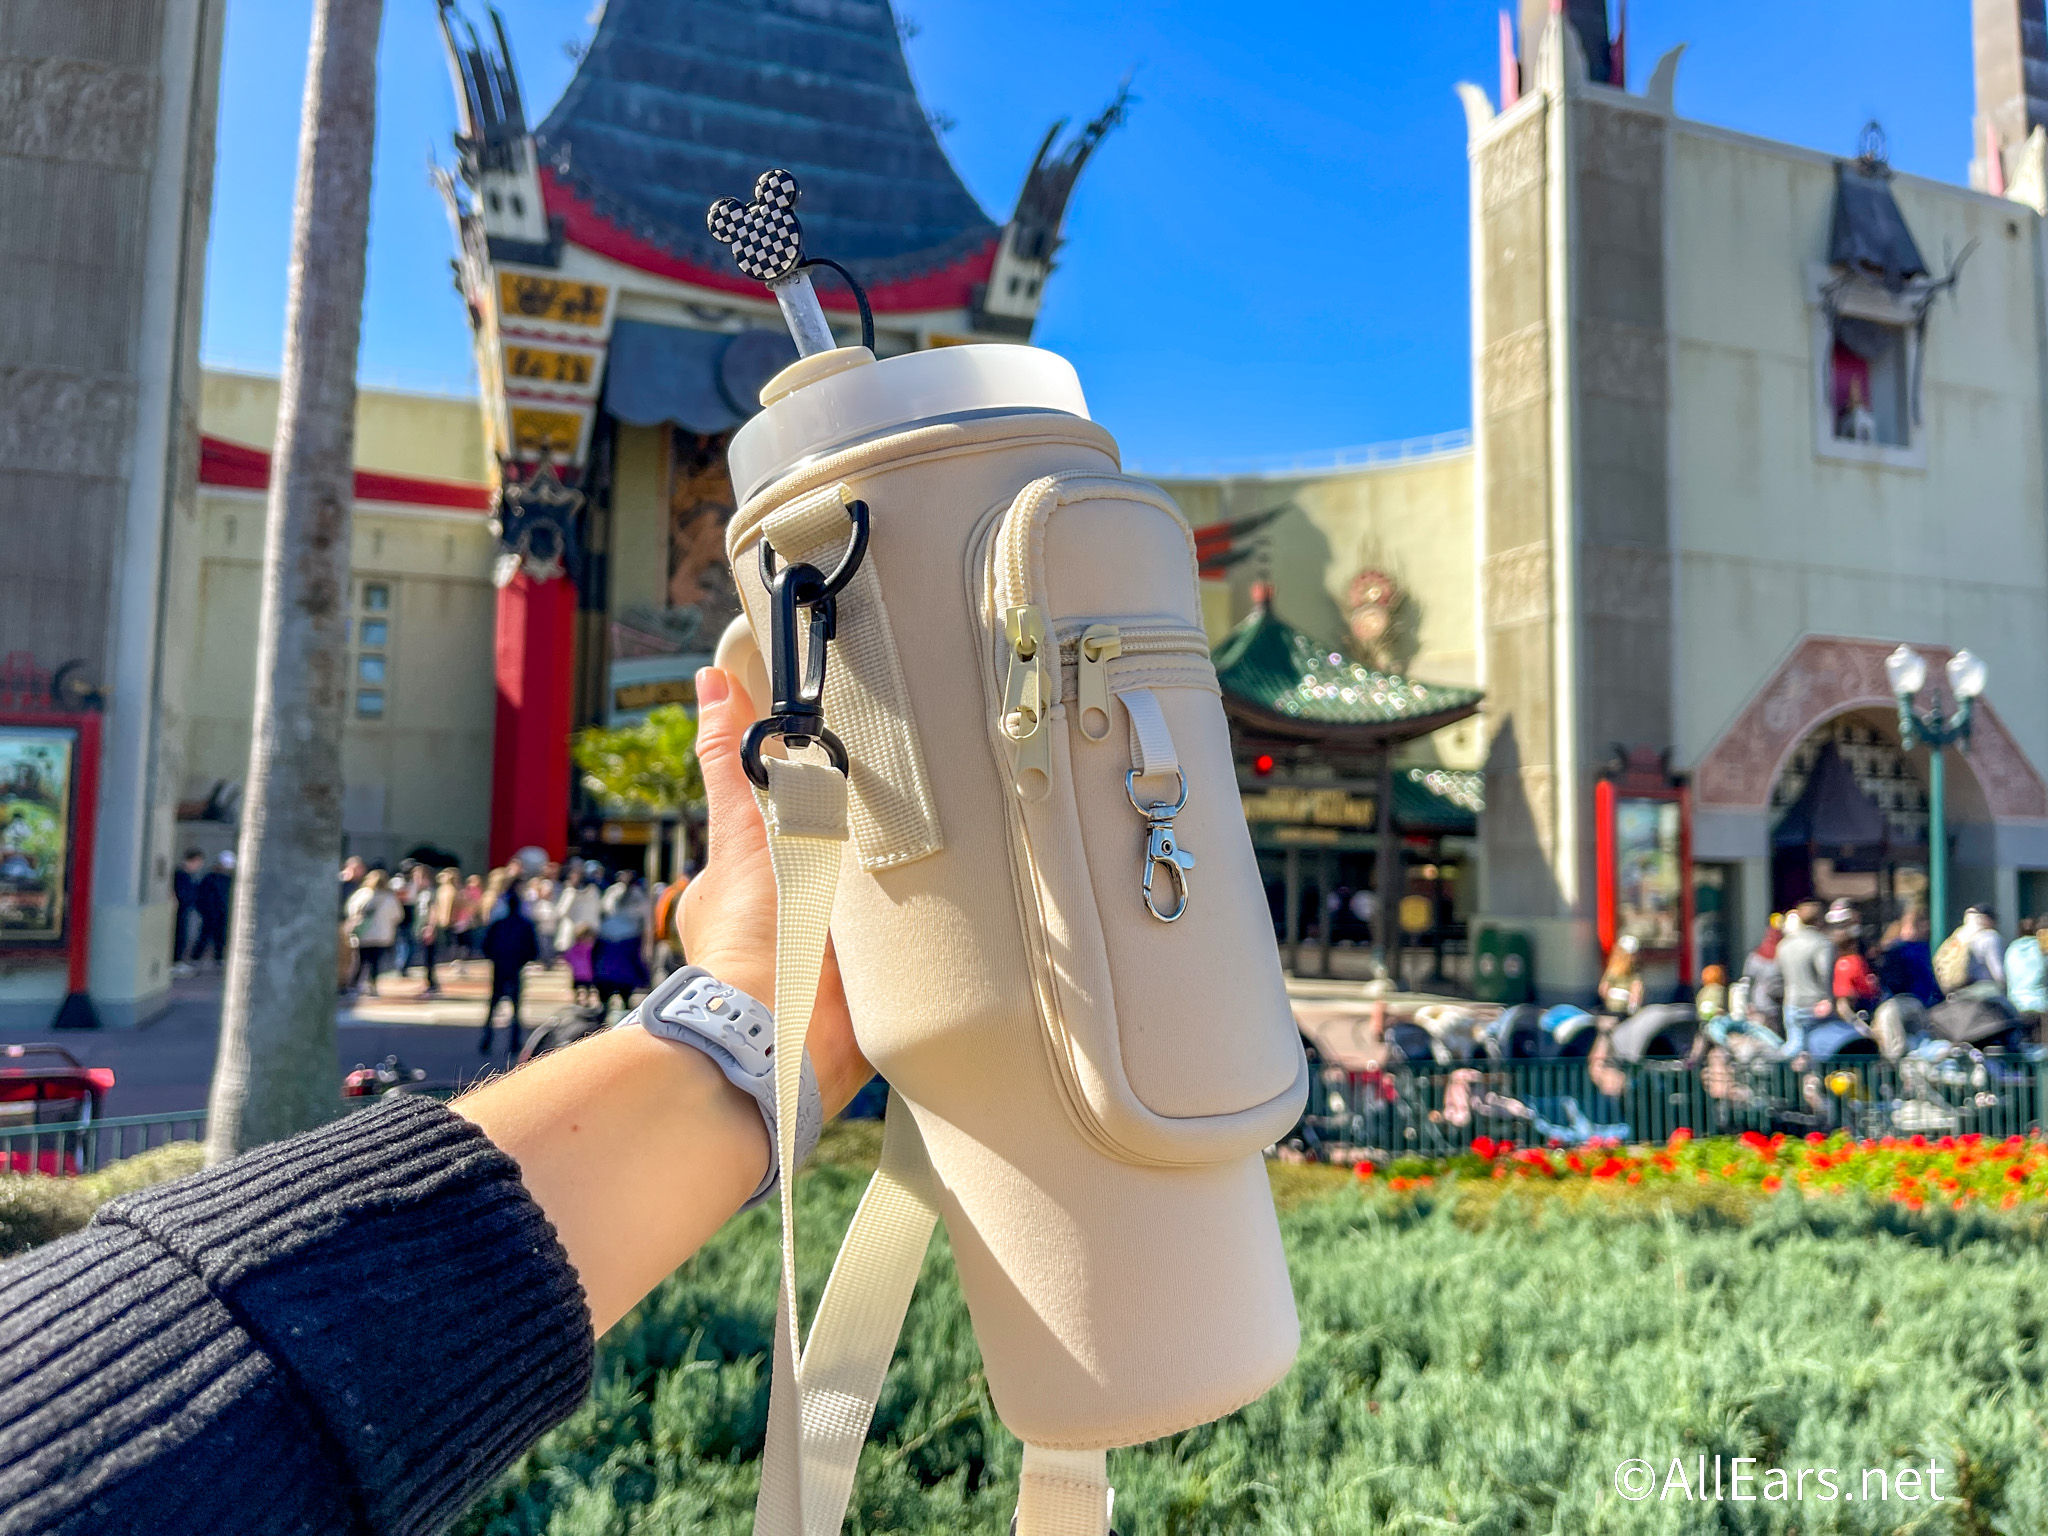
Lights, Motors, Action! Extreme Stunt Show explosive finale. © Scott Thomas Photography 2007
Nikon D70/18-200VR, 1/250s, f/8, 200 ISO, 0 EV, 20mm Focal Length
Don’t go away! Histograms are not hard to understand. They are a great tool for us digital photographers to know, at a glance, if the picture we just took is well exposed. No more being disappointed when we see the photos on our large computer screens that looked so good on the camera’s little LCD. If you are not sure if your camera is able to show a histogram, check its manual.

Simply put, a histogram is a graph that displays how light is distributed in your picture. The left side of the graph represents the shadows (dark areas), while the highlights (light areas) are on the right. Remember bell curves from your old math or statistical classes? Rarely does a histogram from a photo take on the look of a perfect bell curve but the principal is the same. You do not want to see the curve bunch up to either side or get cut off which is referred to as a clipped histogram. A clipped histogram to either the left (dark) or right (light) side is something to be avoided. In the histogram example shown here, while there is a spike on the dark side, it is not clipped and falls off before the edge. The spike can be seen in the dark upper portions of the image.
By taking a photograph and looking at the histogram my camera shows me, I can tell if I have overexposed (histogram pushed to the right side or cut off) portions or all of the image. From there, I can adjust my exposure using the exposure compensation button. I may need to change the ISO setting if the histogram is showing a very underexposed (everything pushed or cut off on the left side of the graph) to increase the sensor’s light sensitivity moving the histogram towards the center.
Take this entry’s photo from the Disney-MGM Studios Lights, Motors, Action! Extreme Stunt Show. I had to be quick with this shot as the car flu over the ramp faster than I was ready for. Checking the LCD image afterwards, I felt it looked good. Once I saw the well-distributed histogram, I was confident it was good.
As you can tell, the histogram is an excellent way to see if you have the exposure you are looking for quickly and easily.
Further Reading: I highly recommend this article on histograms: Understanding Your Digital Camera’s Histogram.


Trending Now
Let's have a chat about an Oura Ring that Disney Adults just can’t seem to...
Here are the park bag mistakes you might make when going to Disney World and...
Ever wondered what Disney World crowds are like on the Fourth of July? We've got...
Universal is growing... but the resort still has some issues.
Listen, these Disney expansion announcements are starting to get way out of hand.
Let's find out your thoughts on if this is still Magic Kingdom's worst fast food...
Here are a couple of clues about Mickey's Very Merry Christmas Party 2025 at Disney...
We know, we know — it’s still summertime, but it’s always a good time to...
This year, the EPCOT International Food & Wine Festival starts August 28th. While we're still...
Costco and Disneyland have just put together the perfect vacation bundle!
BREAKING: Spaceship Earth is temporarily closing this summer at EPCOT!
Disneyland quietly made this changes, but we definitely noticed.
I've flown Spirit Airlines TONS of times, and here are the 3 things you really...
July is here! Can you believe we’re now onto the back half of the year?!...
You might want to AVOID buying Disney World Lightning Lanes on these days in July.
You need to check out these new Stanley Cup colors on Amazon!
A classic Disney attraction is closing soon!
I'm a patient person (that's a lie), but I'm REALLY starting to wonder if Disney...
We finally know the name of Disney World's upcoming tavern!
We just got the full lineup for the Eat to the Beat Concert Series at...